CastorisCausa

Personal blog and hacks by Raymundo Cassani

Often, there is the need of generating a random RGB color for LEDs. The most common approach is to obtain a random value between 0 and 1 (or 0 and 255) for the Red, Green and Blue channels.
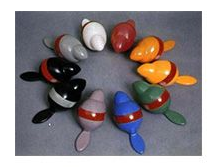

RGB cube

This approach, however, leads to dark and light colors which may not be goal when picking a random color for a RGB LED, we want color!

As such, an alternative is to pick a color in the HSV space, more specifically in the circle at the top of the HSV cone (value=1). While this avoids dark colors, there is a large probability of getting light (pastel) colors. Thus the search for random colors can be constrained to be nearby the rim of such circle, this is to say saturation cannot be smaller than 0.8.


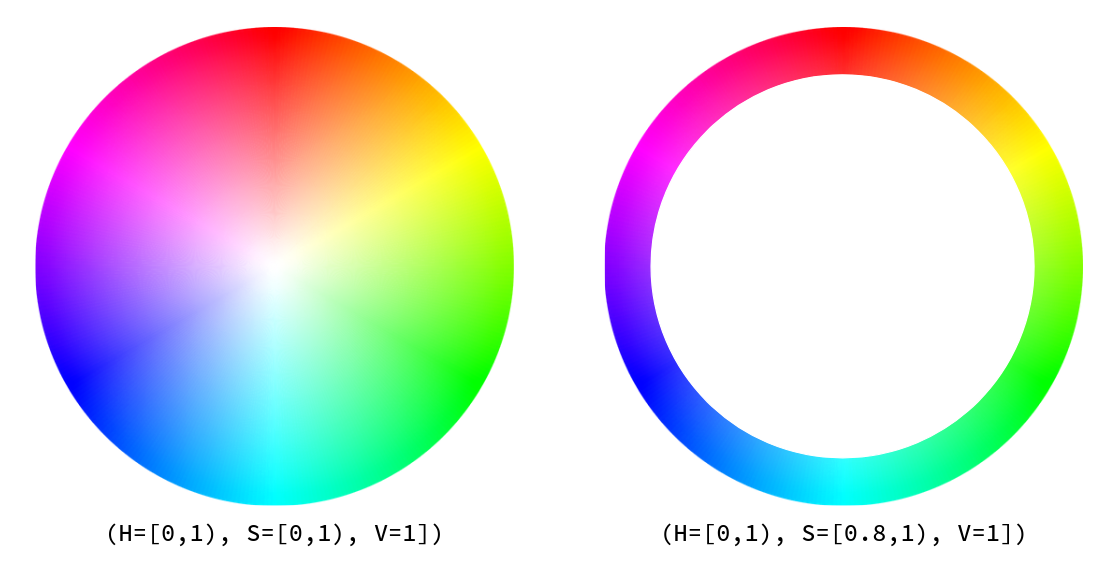
Circle at the top of the HSV cone (value=1). Left, saturation=[0, 1). Right, saturation=[0.8, 1).

Lastly, this Python scripts shows the results of picking 625 colors from the RGB space (left) and the outer rim of the value=1 HSV circle (right).


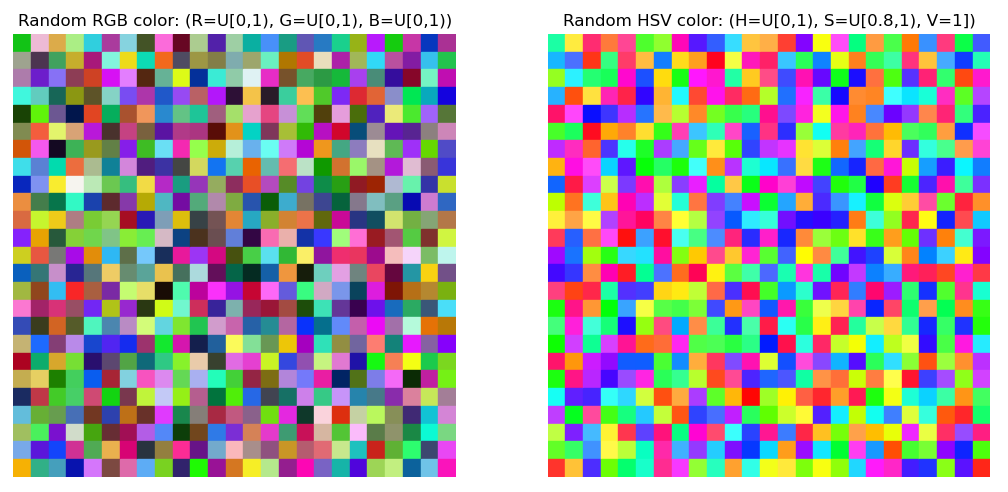
Picking random colors from the RGB space (left) and the outer rim of top of the HSV cone (right).

 1
 2
 3
 4
 5
 6
 7
 8
 9
10
11
12
13
14
15
16
17
18
19
20
21
22
23
24
25
26
27
28
29
30
31
32
33
34
35
36
37
38
39
40
41
42
43
44
45
46
47
48
49
50
51
52
53
54
55
56
57
58
59
60
61
62
63
64
65
66
67
68
69
70
71
72
73
74
75
76
77
78
79
80
81
python
#!/usr/bin/env python3
# -*- coding: utf-8 -*-
"""
Random colors for RGB LEDs

Random RGB (R=U[0,1), G=U[0,1), B=U[0,1)) can lead to dark and light colors 
which may not be goal when picking a random color for a RGB LED

This shows how to pick a color in the HSV space (H=U[0,1), S=U[0.8,1), V=1])
and convert it to RGB. Note that the Saturation is sampled such that colors
are picked from the rim of the Value=1 disk in the HSV space, this to say,
close-to-white colors are avoided.

@author: rcassani
"""

from matplotlib import pyplot as plt
import matplotlib.patches as mpatch
import numpy as np


def hsv_to_rgb(h, s, v):
    # HSV (1.0, 1.0, 1.0) to RGB (1.0, 1.0, 1.0)
    # See matplotlib.colors import hsv_to_rgb
    i = (h * 6.0).astype(int)
    f = (h * 6.0) - i
    p = v * (1.0 - s)
    q = v * (1.0 - s * f)
    t = v * (1.0 - s * (1.0 - f))
    i = i % 6
    if i == 0: return (v, t, p)
    if i == 1: return (q, v, p)
    if i == 2: return (p, v, t)
    if i == 3: return (p, q, v)
    if i == 4: return (t, p, v)
    if i == 5: return (v, p, q)

# Create figure and subplots
plt.close('all')
fig = plt.figure()
ax_rgb = plt.subplot(1,2,1)
ax_hsv = plt.subplot(1,2,2)

# Number of colors (n_cols × n_rows)
n_cols  = 25
n_rows  = 25

np.random.seed(10)
rng = np.random.default_rng()

for i_col in range(n_cols):
    for i_row in range(n_cols):
        # Random RGB        
        rgb_rnd = rng.random(3) # U[0.0, 1.0)
        # Random HSV to RGB
        rgb_hsv = hsv_to_rgb(rng.random(1)[0],      # h
                             rng.uniform(0.7, 1.0), # s
                             1)                     # v

        # Position of patches
        x_pos = i_col * 2
        y_pos = i_row * 2
        # Add patches
        ax_rgb.add_patch(mpatch.Rectangle((x_pos, y_pos), 2, 2, color=rgb_rnd))
        ax_hsv.add_patch(mpatch.Rectangle((x_pos, y_pos), 2, 2, color=rgb_hsv))

# Configure axes        
ax_rgb.title.set_text('Random RGB color: (R=U[0,1), G=U[0,1), B=U[0,1))')
ax_rgb.set_xlim(0, 2 * n_cols)
ax_rgb.set_ylim(2 * n_rows, 0)
ax_rgb.set_aspect('equal')
ax_rgb.axis('off')

ax_hsv.title.set_text('Random HSV color: (H=U[0,1), S=U[0.8,1), V=1])')
ax_hsv.set_xlim(0, 2 * n_cols)
ax_hsv.set_ylim(2 * n_rows, 0)
ax_hsv.set_aspect('equal')
ax_hsv.axis('off')

plt.show()

Comments

comments powered by Disqus