Updated: After receiving feedback on this post, I updated this post by adding at the end a similar map but using the driving times, rather than the Euclidean distances.
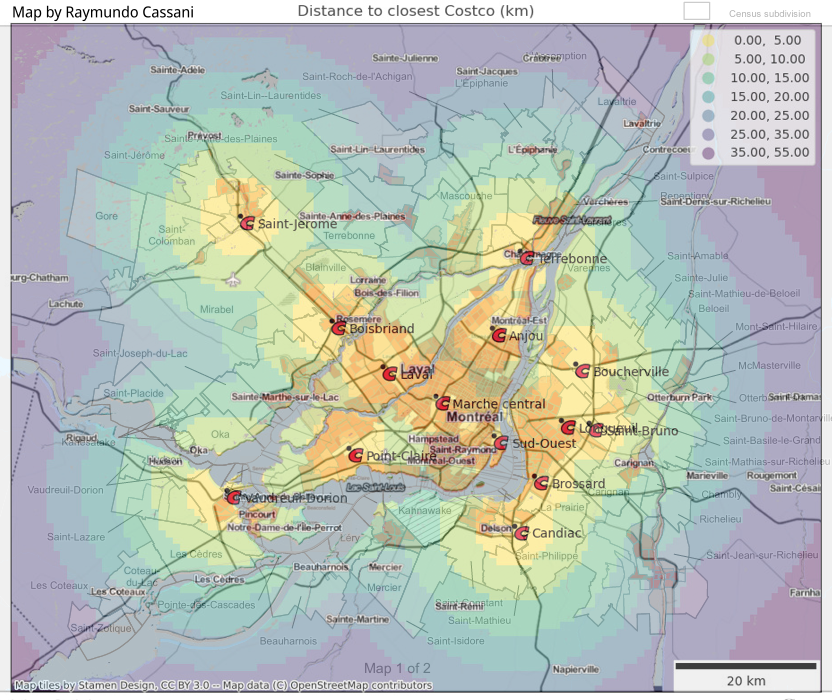
Interactive maps: Minimum linear distance to a Costco and Minimum driving time to a Costco
Once clarified the different meanings of Montreal, I'm in a better position to solve a question inspired by a conversation with a friend, the question is:
For city, I'll be using a map, that encompasses all the interpretations of Montreal.
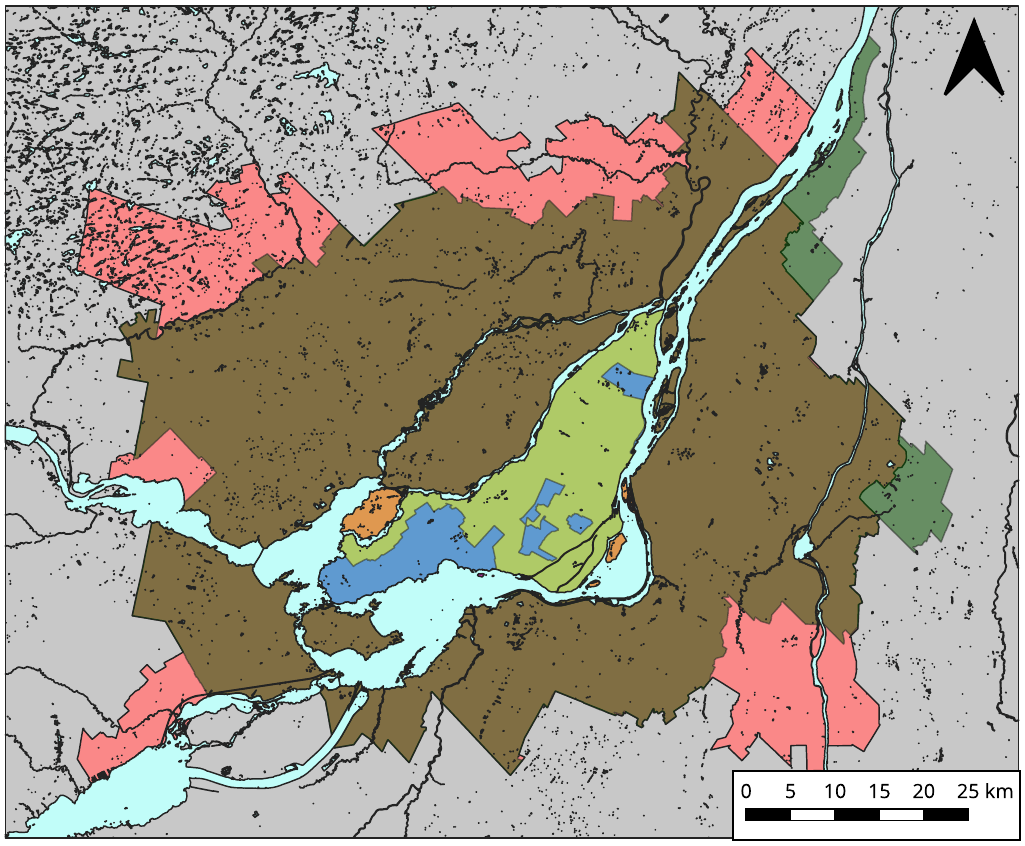
Map for the different "Montreal" meanings
This post briefly describes the steps to answering the question, implemented as a script (code and data available here), using GeoPandas. If you only want to see the result, jump directly to the map at the end.
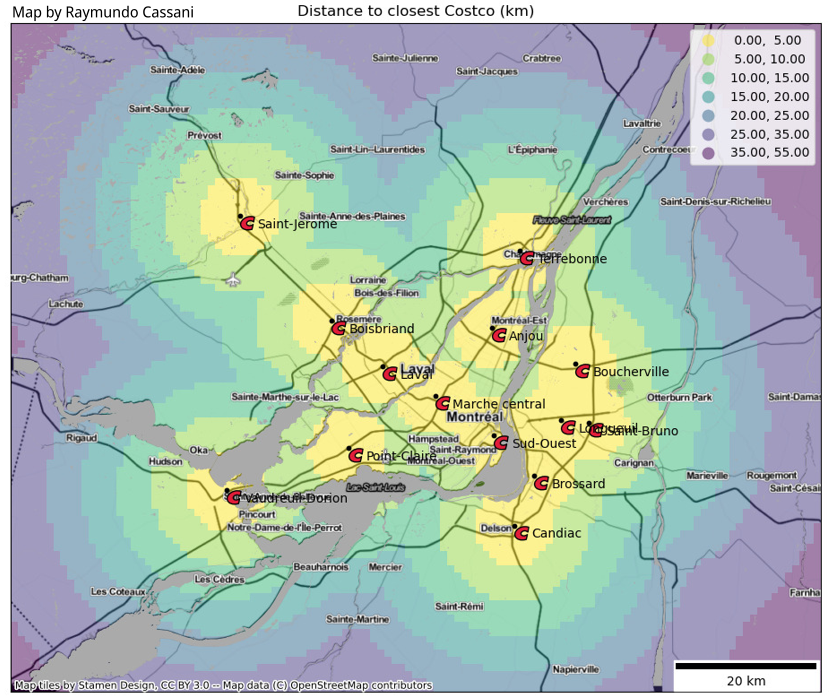
Costco stores in my area
The location of the stores in the Montreal is available in their Quebec stores listing. These addresses were then cross-checked with OpenStreetMap and Google maps. Oh surprise! the addresses did not always matched, thus, I had to verify the addressed (street number, street and postal code) with Canada Post. Interestingly the address in the Costco site were the correct. Don't worry, I've submitted the corrections in OpenStreetMap and Google maps.
There are a total of 14 stores in the area: Sud-Ouest, Marche central, Point-Claire, Anjou, Laval, Boucherville, Longueuil, Saint-Bruno, Brossard, Candiac, Vaudreuil-Dorion, Terrebonne, Boisbriand and Saint-Jerome.
Overview of the process
With all the information at hand, making the map as straight forward:
- Geocoding, converting the store addresses to locations on Earth
- Defining the map boundaries
- Making a grid in the map
- Computing the distance between each store location and each point in the grid
- Finding the minimum of those distances
- Plotting

This as a fun project, it can be easily modified to do the same analysis with other points for interest.
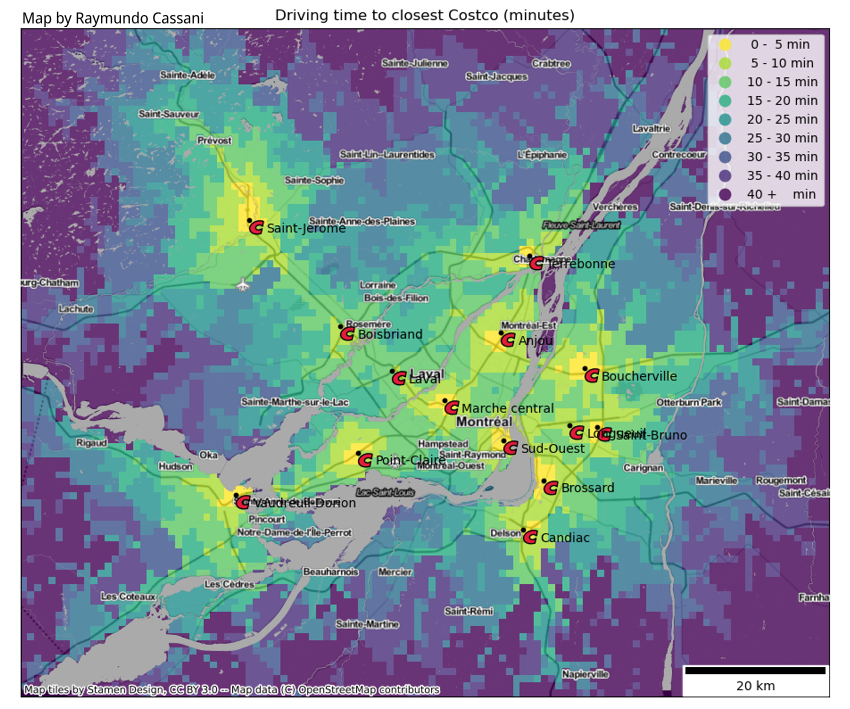
Using driving times
How does the map change if driving times are used instead of linear distances? To obtain map below, the isochrone maps were obtained for each store location with Openrouteservice. Then, for each point in the map grid the minimum driving time to a store was selected. This is the result.
Relation with population density?
As a quick exploration, this distance-to-Costco map above was plotted on the 2021 population density map of the area. The result is interesting, and led to make the prediction:
The next Costco store in the region will open in Saint-Jean-sur-Richelieu.
Red background shades indicates high population density.


Comments
comments powered by Disqus